The I3E Model

In response to the global climate crisis, the need to design adequate climate change policies in Ireland is becoming increasingly important. Moreover, Ireland is obliged to decrease its emissions under the EU Commission’s Climate and Energy Package. It is required to deliver a 20% reduction in greenhouse gas emissions not covered by the EU’s Emissions Trading Scheme (ETS) by 2020 relative to 2005 levels, increasing to 30% in 2030. Hence, designing appropriate energy policies to ensure a smooth and least-cost transition to a low-carbon economy is imperative. Research is needed to better understand the economic and environmental impacts of policies to advise the policy-making process. For this purpose, the Ireland Environment, Energy and Economy model (I3E) has been developed.
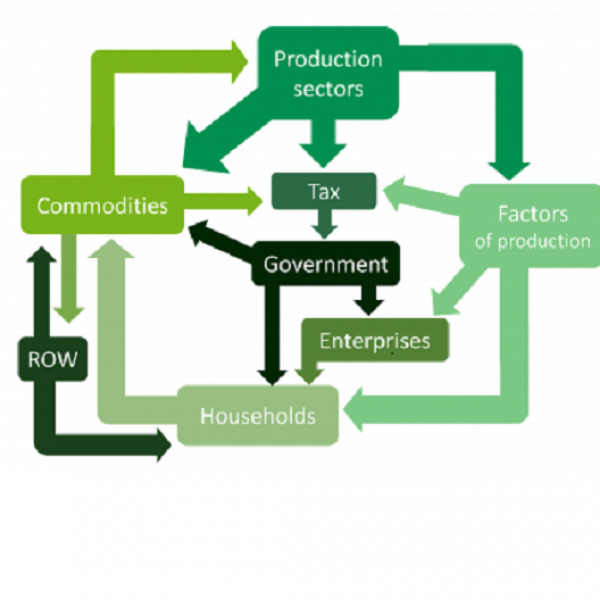
The I3E model is an intertemporal computable general equilibrium (CGE) model, which reproduces the structure of the economy in its entirety. It includes productive sectors, households, and the government, among others. In the model, the nature of all existing economic transactions among diverse economic agents is quantified. According to microeconomic behaviour, producers/consumers maximise their profits/utility given their budget constraints. In other words, a CGE model examines how inputs and outputs flow between production sectors of the economy and finally result in final goods consumed by households.
The explicit modelling of sectorial inter-linkages makes it possible to investigate the wider economic impacts of a specific shock or policy through the different transmission channels in the economy. Therefore, CGE models have become a standard tool of empirical analysis. They are widely used to analyse the welfare and distributional impacts of policies whose effects may be transmitted through multiple markets and channels in the economy. Because of its nature, CGE modelling is highly useful for policy design and evaluation, specifically when policy measures are expected to lead to indirect, as well as direct, effects, as in the case of energy-related policies. For example, the economic implications of an energy tax in the transport sector can be evaluated both for the transport sector and other sectors through inter-sectoral spill-overs.
Due to the level of detail, it is also possible to simulate specific policies, e.g. taxes on coal inputs, subsidies for renewable energies, etc. Hence the impacts of different types of energy policies that lead to the same mitigation goal can be investigated. Furthermore, CGE modelling presents the opportunity to evaluate distributive effects within the economy, and therefore identify winners and losers from certain policies, at the household level.
The I3E model includes energy flows and emissions in addition to the standard monetary flows. Each production sector produces an economic commodity using labour, capital, material inputs and energy inputs. The I3E model explicitly comprises a set of carbon commodities, including: peat, coal, natural gas, crude oil, fuel oil, LPG, gasoline, diesel, kerosene, and other petroleum products. Production activities produce commodities in the cheapest way possible by using the optimal set of capital, labour, energy and other intermediate inputs, based on both relative prices and substitution possibilities. When an energy policy is implemented (e.g. an increase in carbon tax) or in case of an external shock (e.g. an increase in international energy prices or ETS price), production sectors will, where possible, substitute energy inputs for other inputs and/or decrease the carbon content of their energy inputs by demanding cleaner energy. From the consumers’ perspective, higher prices of goods with higher carbon content will encourage them to consume less carbon-intensive products. The explicit inclusion of emissions makes it possible to evaluate the emissions reduction associated with a specific policy or to calculate the specific policies needed to reduce emissions to a certain target.
I3E is a dynamic model, which incorporates economic growth over the modelling horizon which runs from 2014 to 2050. Economic growth originates from three sources: the growth of employment driven by population growth, the growth in capital stock driven by investment, and the growth in total factor productivity or productivity of factors of production. It is assumed that the total population grows at a constant rate and the technology, i.e. the productivity of labour force, also grows at a constant rate. In the current version, the values of population growth and economic growth are retrieved from the medium-run estimates of the macroeconometric forecast model of the ESRI, namely COSMO (COre Structural MOdel for Ireland).
More details
The following subsections explain the characteristics of each agent and the assumptions driving the economic relationships among these agents in a non-technical manner to facilitate a better understanding of how the I3E model works. For the technical details of the model, see the technical report. The data sources and the construction process of the Irish energy social accounting matrix is also available here .
A CGE model's household sector consists of Representative Household Groups (RHGs). A RHG represents all households with one or several common characteristics. This is one of the basic assumptions of CGE modelling, although it has restrictive repercussions. For instance, each household within an RHG is assumed to behave identically: they have the same set of preferences. In other words, the aggregation of households into a group eliminates all heterogeneities across households regarding differences in their characteristics. To account for this, the I3E model includes ten RHGs to provide more granular information.
In the I3E model, the household sector is firstly divided into two major groups based on the area of residence of households: urban RHGs and rural RHGs. Subsequently, each of these major groups is further disaggregated into five RHGs according to household disposable income. The RHGs with the abbreviations of u1 to u5 are the urban resident households, and u1 (u5) represents the poorest (richest) RHG. Similarly, the RHGs with the abbreviations of r1 to r5 are the rural resident households, and r1 (r5) represents the poorest (richest) RHG.
These ten RHGs are constructed by using the Household Business Survey (HBS) of 2015-2016. The survey provides information on the area of residence and the household-level disposable income. Each household in the survey is uniquely assigned to an RHG, and then the household-level values of all income items and private consumption expenditures by commodities are aggregated to generate the RHG level figures. As the RHGs defined in the I3E model have distinct compositions of disposable income and private consumption derived from the HBS, the model is able to display heterogeneous policy impacts across household types.
Households make their decisions based on the maximisation of their utilities in an intertemporal manner subject to their budget constraint. RHGs take various issues into account in their decision-making process, including the valuation of tomorrow relative to today (time preference rate), the future values of commodity prices and the interest rate, and economic growth. Each household chooses the optimal level of consumption in the utility maximisation process, and its savings are determined as a residual, i.e. what they do not spend, they save. The budget constraints of RHGs equate the disposable income --the sum of wage income, dividend income, welfare transfers and pension income from the government, and net factor income from abroad-- to the sum of total consumption expenditures and savings. The equilibrium between total income and expenditures must hold in every period of time. By disaggregating households into ten RHGs, more granular impact analyses can be carried out on various climate policy options.
The production sector comprises 32 representative activities/firms. The main data source to replicate inter-sectoral linkages in the Irish economy is the Supply and Use Tables (SUTs) provided by the Central Statistics Office (CSO). The original SUTs comprise 58 industries and provide information on which industry produces which products, the monetary value of production of each product, the cost of intermediate inputs, the value of gross value-added (payments to the factors of production), production taxes paid to the government, etc. These production sectors are firstly merged into 26 sectors based on their shares in total value-added, employment and emissions. Subsequently, three sectors (Mining, Quarrying, and Extraction; Petroleum, Furniture, and Other Manufacturing; and Electricity and Gas Supply) are further disaggregated, and the total number of activities reaches 32.
The production sectors defined in the I3E model have several heterogeneities regarding the number of commodities produced, the investment decision, the composition of energy demand, and the coverage of sectoral emissions by the Emission Trading System, etc. All those heterogeneities are introduced in the I3E model and internalised in several decision-making processes.
- Multi-Product Producers: Firms are able to produce multiple products, i.e. a firm can produce two or more products which are either secondary outputs of the primary production process or entirely different products. Some of the firms produce only one commodity, e.g. public administration, or the shares of secondary products are quite negligible in total production.
- Investment Decision: 27 out of 32 activities determine the level of physical investment, i.e. additions to their physical capital stock, by maximising the value of the firm in an intertemporal manner. In this problem, firms consider the future levels of prices of capital, as well as the value-added and the interest rate. Having an intertemporal investment decision of firms allows the I3E model to explore economic dynamics in a more realistic framework. In the absence of such a feature, the model dynamics would only rely on the consumption smoothing of households, as households seek to achieve a stable level of utility over time.
- Energy Demand: The composition of each firm's energy demand across energy commodities is based on the nature of the production process. Some sectors do not have an opportunity to switch their energy demand from one energy commodity to another, whereas some sectors can substitute an energy commodity for another at different degrees of substitutability. In order to introduce heterogeneities across sectors in terms of their ability to switch between energy inputs, three different substitution elasticities, i.e. degrees of substitution, are defined, and each firm is uniquely assigned to a group.
- Emissions Trading System (ETS): The ETS is the primary environmental policy tool of the European Union (EU). A share of combustion-related emissions of the manufacturing sectors and the emissions of energy production sectors are subject to the EU-ETS legislation. Each installation has to buy emissions permits/allowances from the EU-wide allowance market via auctioning if the installation's ETS emissions exceed its free allowances/permits. If an installation's ETS emissions are lower than its free allowances, the installation can sell its remaining free allowances in the same market. In other words, the ETS introduces a cost item for those firms which have higher emissions than their free allowances, whereas firms with lower emissions relative to their free allowances can receive additional income. The term “installation” is defined as a production unit and it is not necessarily a firm. For instance, each production unit of a firm in different locations is a separate installation, and each receives its own free allowances. Since the I3E's production activities are defined on a firm basis, free allowances of multiple installations of a firm are aggregated to firm-level free allowances. Each activity's ETS coverage, i.e. the activity emissions subject to the ETS, are different. Therefore, each I3E activity has to take into account its composition of energy demand, ETS coverage, and free allowances to reduce its ETS emissions and thus the cost of the ETS. In the case of Ireland, the implementation of the EU-ETS legislation in an applied model raises some complexities due to the mixed usage of the ETS and carbon taxation. In order to prevent double taxation, the Irish government exempts the emissions covered by the ETS from the carbon tax. In other words, firms in Ireland subject to the EU-ETS legislation must directly internalise both the cost of ETS and the carbon tax exemptions in their cost minimisation problems. In this respect, in the I3E model, economic activities directly internalise these items in their decision-making process to minimise the cost of production. Each activity pays the same purchaser, i.e. retail, price to buy an energy commodity but the perceived cost of unit demand includes both the cost of ETS and the carbon tax exemptions which are functions of the activity’s emissions covered by the EU-ETS, the level of its free allowances, and the EU-ETS price which is an exogenous variable.
The first two items in the above list are not directly related to analysing the economic impacts of a transition to a low-carbon economy. They are much more related to introducing the production and investment decisions of activities in more appropriate ways. The third one is a crucial feature of the I3E model since it allows us to quantify the differentiated impacts of a policy change; for instance, an increase in the carbon tax, across production activities. If a sector has more substitution possibilities across the energy commodities, the higher level of the carbon tax leads the sector switching from fossil fuels to cleaner energy commodities to meet its energy demand. On the other hand, if a sector has limited or no possibility to switch its energy demand, the sector is hit harder due to impacts on its cost of production (higher carbon tax increases the cost of energy since the firm has to use the energy commodities with a carbon content) and thus the sectoral value-added and labour demand. The fourth component also plays a substantial role in an analysis of transitioning to a low-carbon economy as the ETS coverage of sectoral emissions and the EU-ETS price of allowances directly affects the cost of production.
The SUTs also include 58 products and provide the sources of total domestic supply and demand. These products are firstly merged into 29 commodities, and then the broader energy commodities are disaggregated into energy commodities, resulting in a total of 39 unique commodities in the I3E model. The energy/carbon commodities included in I3E are:
- peat
- coal
- natural gas
- diesel
- gasoline
- kerosene
- LPG
- crude oil
- fuel oil
- other petroleum products
- electricity
The total supply of a commodity comes from two sources: domestic production and imports. Out of 39 commodities, 37 are domestically produced, and 33 of them are also imported, i.e. four commodities are supplied entirely by domestic producers (education services, residential services, construction, and peat). On the other hand, there is no domestic production of crude oil and coal, and they are entirely imported. The total domestic demand for a commodity c is equal to the sum of six items:
- intermediate input demand is the sum of all activities' optimal level of demand, which comes from the cost minimisation problem of activities;
- private (household) demand is the sum of all households' optimal level of consumption and stems from the utility maximisation problem;
- government demand is a fixed fraction of total government demand for commodities;
- investment demand, i.e. investment by origin, is a fixed fraction of total investment expenditures of activities,
- trade and transportation margin demand is a fixed fraction of total domestic supply of commodity c; and finally,
- export demand is a function of the domestic price and foreign price of commodity c and the substitution elasticity of these two commodities.
The transition to a low-carbon economy mainly includes the phasing out of fossil fuels, especially peat and coal, in space heating (primarily demanded by households) and electricity production. The electricity production sector's energy demand will change in favour of renewable energy sources and households will use electric heating systems. In this respect, as the demand on the aforementioned energy commodities (except natural gas and electricity) declines, the supply of these commodities shrinks, and thus the composition of domestic production will change. Therefore, the explicit introduction of all energy commodities is an essential feature of the I3E in analysing the economic impacts of the transition.
There are three types of labour in the I3E model: low-skilled, medium-skilled, and high-skilled. In order to introduce the composition of household wage income regarding the labour types, the Survey on Income and Living Conditions (SILC) is utilised, as the HBS does not provide individual-level information. In the SILC, all households are uniquely assigned to an I3E RHG, and the compositions of wage income by RHGs are retrieved by considering the level of educational attainment of all working members of the households. For the production activities' labour demand by types of labour, the Labour Force Survey (LFS) is utilised. This level of detail provides a better understanding of the impacts on various types of labours and thus household wage income which is the main component of household disposable income.
Net migration flows to Ireland play an important role in the labour market structure in Ireland. In periods of economic expansion, for instance, as the wage rate increases and the unemployment rate decreases, the net migration into Ireland and thus the total labour supply in the economy increases. As the higher supply of labour lessens the upward pressure on the wage rate, firms are able to hire more employees without increasing their labour costs substantially. In periods of economic contraction, on the other hand, decreasing emigration lowers the total labour supply and prevents both larger declines in the wage rate and increases in the unemployment rate. In other words, net migration plays an important cushioning role in the Irish labour market. In order to reflect the structure of the Irish labour market, the model incorporates involuntary unemployment and international migration. In the model, the total net migration is a function of the per-employee real net-of-tax wage income differential between Ireland and the rest of the world. As there are three types of labour in the I3E model, the disaggregation of the total net migration figure across the labour types is required. To this end, the LFS data is utilised to calibrate the share parameter of each type of labour in the total migration and the net migration by skill type is calculated. The total labour supply of each type of labour is the sum of the net migration and the fraction of the Irish population that participates in the labour market. In this version of the model, the participation rate is assumed to be a parameter, i.e. the labour supply decision of the Irish population does not respond to changes in the labour market. The level of unemployment is the difference between the total labour supply and the total labour demand stemming from the cost-minimisation problem of firms. For a given level of unemployment for each type of labour, the unemployment rate is calculated as a per cent of total labour supply, i.e. labour force. The equilibrium wage rate for each type of labour is determined by separate wage equations which relate the log of wage rate to the log of the unemployment rate.
The model includes an ``enterprises'' account, where a representative enterprise is assumed to be the owner of all firms. The enterprise account collects all gross sectoral profits and receives transfers from the government, which are fixed in nominal terms, and pays corporate tax to the government. The remaining amount is either saved by the enterprise account (fixed fraction of net-of-tax profit receipts) or paid to households as dividend payments. Having a separate account for enterprises is not directly related to analysing environmental policies but simplifies some details of the model and also solves the issue of a lack of sector-specific data such as corporate tax payments.
The I3E model has an explicit representation of the government sector. The government collects direct taxes on labour incomes and sectoral profits (corporate tax), indirect taxes on sales of commodities, the carbon tax on energy commodities, the export tax on exported electricity, production tax on production activities, and half of the cost of ETS due to the EU legislation. The carbon tax, which is exogenously determined by the government, is implemented as a fixed price of per-tonne equivalent of carbon and collected on the domestic consumption of energy commodities.
The government allocates its total revenues to the consumption of commodities, welfare transfers and pension payments to households (fixed in real terms - indexed to the average wage), transfers to enterprises (fixed in nominal terms), and interest payments over the outstanding foreign debt stock.
The total government consumption on commodities has an autonomous part which is fixed in nominal terms, and an induced part which is a positive function of the current period's nominal gross domestic product. This structure indicates that Irish fiscal policy is pro-cyclical and is consistent with the previous findings of the ESRI. The difference between total revenues and expenditures of the government is public saving which drives changes in the foreign debt stock, i.e. as public saving increases (decreases), the government debt stock becomes lower (higher).
The detailed government account is an essential characteristic of a CGE model due to the fact that a change in the structure of the economy has repercussions on the government budget and thus income distribution and welfare, even if there is no change in any policy variable controlled by the government. For instance, changes in the composition of private demand change the tax collection of the government over the consumption of commodities. However, as environmental policies are determined by governments via the imposition of taxes or banning the use of environmentally harmful commodities (such as single use plastics), they have direct implications on demand for commodities and thus the government budget constraint. In the transition to a low-carbon economy, each policy option of the government, such as higher carbon tax, lower subsidies on fossil fuels, ceasing of fossil fuels, subsidising investments on cleaner energy sources - among others - has differentiated effects on the overall economic activity, profits of firms, employment, household welfare, etc. Analysing the potential implications of each of these options, solely or jointly, requires a detailed government account.
As in the case of all single-country CGE models, all countries except Ireland are assumed to be a single unit referred to as the Rest of the World (RoW). All monetary flows between the rest of the world and Ireland are traced within the RoW account. Since all transactions related to this account are assumed to be denominated in a foreign currency, an exchange rate adjustment takes place. In the case of Ireland, although there is no exchange rate discrepancy for the transactions within the EU, almost two-thirds of the value of foreign trade consists of trade flows between Ireland and the United States and Ireland and the United Kingdom. As there is no distinction between these trade partners within the I3E model, the exchange rate movements play an essential role.
The sources of the foreign exchange supply are exports of commodities and the net factor income of households. As the rest of the world is not introduced in the model explicitly, i.e. there are no foreign agents with maximisation behaviour, it is assumed that all exports of Ireland are absorbed by the rest of the world. The volume of export is a function of exogenous international commodity prices and the elasticity of substitution between sales in the domestic market and exports. The sources of foreign exchange demand are imports of commodities, the interest payments of the government over the outstanding foreign debt stock, and half of the cost of ETS due to the EU legislation. The difference between the totals of foreign exchange supply and demand is covered by foreign savings, i.e. the current account balance. The foreign market closure rule implies that for the given level of foreign savings, the equilibrium in the rest of the world account is ensured by the exchange rate adjustment.
Current Policy Analysis of the I3E
The current version of the I3E model is amenable to the analysis of several climate policies. Some of those policy options have already been studied, and their results are published. The following set of policy options have been analysed:
- Carbon Tax: The All Government Climate Action Plan proposes to gradually increase the carbon tax from €20 per tonne equivalent of carbon, to €80 per tonne equivalent in 2030. Such an increase in the carbon tax without any other changes in the policy setting, i.e. without the recycling of carbon tax revenues, is analysed.
- Carbon Tax and Pure Recycling Schemes: The I3E model allows the government to recycle its total or additional carbon tax collections within the economy. In the literature, governments are assumed to recycle their entire carbon tax collections. However, given that current Irish carbon tax revenues received have not been earmarked for a specific purpose, we assume that only the additional carbon tax revenue (for collection of a carbon tax above €20 a tonne) will be recycled. For instance, in 2030 and onwards, the government will recycle 75% of the total carbon tax collections (i.e. €60 of the €80 carbon tax). Each recycling scheme is considered for two cases: the government uses the entire or additional carbon tax revenues in the recycling scheme. In the model, the effects of seven pure recycling schemes in 14 different scenarios are evaluated as follows:
- reduction in sales tax rates of commodities (energy commodities and alcoholic beverages and tobacco products are excluded from the scheme in the scenarios);
- reduction in wage income tax rates of labour types;
- reduction in the corporate tax rate;
- reduction in production tax rates;
- increase in the government commodity demand;
- transfers to households by using the welfare system; and
- transfers to households in a lump-sum (per capita) manner.
- Carbon Tax and Mixed Recycling Schemes: Several mixtures of the above pure recycling schemes are evaluated. In these experiments, the I3E is flexible in distributing the recycled carbon tax revenue (entire or additional) across different components. For instance, the government may choose to use 20% of the recycled carbon tax income to lowering wage income tax rates and the remainder to make transfers to households. Any distribution rule can be defined. The scenarios which have been run up to date include:
- reduction in wage income tax rates of labour types and transfer to households by using the welfare system;
- reduction in wage income tax rates of labour types and transfer to households in a lump-sum manner;
- reduction in the production tax rate of the transportation sector and transfer to households by using the welfare system; and
- reduction in the production tax rate of the transportation sector and transfer to households in a lump-sum manner.
- Energy Demand Projections: The I3E model does not, and cannot, include several policy options such as retrofitting subsidies or biofuel blending. Together with the Sustainable Energy Authority of Ireland (SEAI), the I3E model is used to establish energy demands and concomitant emissions for Ireland. In this process, the I3E model estimated future energy demand (across fuel types and sectors), the SEAI then adjust these numbers based on their own micro analysis of policy impacts. These projections are produced for three different sets of international energy prices (baseline prices (the current level of international prices), low prices and high prices) and a sequence of the ETS price (in a positive trend) provided by the European Commission.
- Energy Demand Projections and Carbon Tax: In all energy projection scenarios, the effects of the increasing carbon tax on the energy commodity demand of each agent are also evaluated.
- Energy Demand Projections, Carbon Tax, and Existing Measures: In addition, these projections (with and without increasing carbon tax) are further extended by the incorporation of the existing measures of the government on ceasing peat and coal in the electricity production sector. The removal of peat and coal, which have the highest content of carbon across the energy commodities, from electricity production are the two main elements of reaching a low-carbon economy.
- Regional Impacts: The results of the experiments on the increasing carbon tax and the existing measures towards a non-peat and non-coal electricity production are used to generate regional labour impacts. This is done by linking production sector level output from the I3E model with production sector data by county. As mentioned above, the phasing out of peat and coal in electricity production is crucial in lowering the CO2 emissions of Ireland.
- Equalising Excise Rates of Diesel and Petrol: This policy measure is proposed in the Climate Action Plan (Action point 7) to reform environmental taxation measures across all relevant tax heads. The I3E is amenable to testing the effects of such a policy change, and a report will be submitted to the Department of Finance concerning this by the end of November 2019.
- ETS Price: In single-county CGE models, international prices are kept constant along any experiment path, since the country is assumed to be a small open economy i.e. it is a price-taker and has no control over international markets. Ireland is a part of the EU-ETS, and the ETS price is determined in the EU-wide carbon market, i.e. the Irish emissions cannot solely affect the ETS price. Therefore, the ETS price is an exogenous variable, and it is assumed that it will be constant unless otherwise stated. The impacts of higher or moderate increases in the EU-ETS price can be examined.
The Level of Details in I3E Outputs
Given the level of detail in the I3E model, based on the economic agents defined in the model, the detailed results of a policy scenario can be reported. For instance:
- At macroeconomic level (not exhaustive): real gross domestic product, trade balance and debt-stock (in levels and as ratios to nominal gross domestic product), average wage, total capital stock, total investment, total domestic demand, total gross value-added, government revenues and expenditures, emissions (distinguished by total, total ETS and total non-ETS), income distribution indicators (income disparity within and between urban and rural areas).
- At sectoral level for 32 sectors: production, labour demand (by types of labour), investment, capital stock, intermediate input demand by commodities, profits, emissions (distinguished by total, ETS, and non-ETS), the cost of ETS, tax payments to the government (production tax).
- At the household level for ten RHGs: real disposable income and its sub-items, consumption per commodities, savings, emissions (in the distinction of total and residential).
- At commodity level for 39 commodities: exports, imports, total domestic demand and its sub-components, tax payments to the government (sales tax, carbon tax, export tax).
- At the enterprise level: total sectoral profits, the total distributed dividends, corporate tax payments to the government.
- At labour type level for three types of labour: total wage income, wage rate, wage income tax payments to the government.
In what follows, we discuss the planned developments of the model pertaining to assessing the economic and employment impacts of a transition to a low-carbon economy and how these developments will impact the policies that can be studied and the outputs that can be delivered.
- Other Pollutants: The current version of the model includes carbon dioxide emissions. Including other pollutants such as Particulate Matter would allow for the combined analysis of climate policies and other environmental issues such as air pollution. The imposition of a tax on the other pollutants is expected to affect the cost of production in a few numbers of sectors and thus the sectoral output and CO2 emissions of the sector.
- Renewable Energy Production: The current version of the model does not have a renewable energy production sector and a set of renewable energy commodities. The reason is the absence of appropriate data to disaggregate the electricity production sector into conventional and renewable energy production sectors and to disaggregate electricity commodity into several renewable commodities. The I3E model will be developed to include this by obtaining data from other institutions and bodies. In the current version, the electricity production sector is assumed to switch its peat and coal demand to natural gas. Since the natural gas commodity also has a carbon content (although it is lower than the carbon contents of peat and coal), the reduction in the sectoral emissions due to a policy change becomes limited. Explicitly representing renewable energy will improve the estimations of the model regarding the emissions reduction and allow for the analysis of, e.g. subsidising renewables.
- Climate Change Module: In the current version of the model, climate change impacts are not taken into account. Ireland is facing significant impacts from climate change in terms of, e.g. changes in agricultural production, coastal impacts, health impacts and changes in energy demand. Including these impacts in I3E will allow us to better understand the economic impacts of climate change as well as better estimate energy demand as the climate changes.
The status of a model is always in progress by introducing new features, extending its current coverage regarding agents and/or commodities, and updating data sources and the calibration process. Notwithstanding the aforementioned planned developments, the current version of the I3E model provides a strong base to analyse various policy options. The strengths of the model are as follows:
- To our best knowledge, the I3E model is the first fully dynamic CGE analysis for the Irish economy. This allows us to explore the possible long-lasting impacts of policy options on both macroeconomic (such as gross domestic product, public indebtedness, trade balance) and microeconomic environments (such as household welfare, income distribution).
- The introduction of the ETS is one of the notable characteristics of the I3E model. The model, for the first time in the context of Ireland, is amenable to distinguishing between ETS and non-ETS emissions.
- As all micro-foundation related parameters are retrieved from the HBS, the household sector incorporates several heterogeneities and reflects the policy impacts in a differentiated manner across households.
- The detailed production sectors regarding firm characteristics, including investment decisions, multi-product production, and the ETS coverage, also play a crucial role in determining the differentiated sectoral impacts of policy changes.
- The number of commodities is large enough to represent the consumption pattern in the Irish economy. As the HBS provides the composition of private consumption by commodities and types of households, the policy impacts on consumption and thus welfare --measured by the change in the value of expenditure function-- are easily quantified. As the focus of I3E is energy--economy--environment interactions, the structure of household consumption and the structure of intermediate input demand of firms are introduced in quite detailed nested structures.
Funding
The development of the I3E model has been funded by the Department of Communication, Climate Action and Environment under the CAMG, (List of ESRI CAMG outputs). The Department of Finance and Department of Public Expenditure and Reform have also provided funding to further develop the model. Other funders include the Environmental Protection Agency, Department of Transport and the Department of Enterprise, Trade and Employment.

